E-ISSN:2456-1487
P-ISSN:2456-9887
RNI:MPENG/2017/70771

Research Article

Blood

Tropical Journal of Pathology and Microbiology

2021 Volume 7 Number 4 July-August
Publisherwww.medresearch.in

Comparison of various principles of coagulation tests in handling hemolysed blood samples

Vani K.1*, Ahmad R.2
DOI: https://doi.org/10.17511/jopm.2021.i04.06

1* Vani K, Associate professor, Department of Pathology, JSS Medical College, JSS Academy of higher education and research, Mysuru, Karnataka, India.

2 Rubaiya Ahmad, Tutor, Shrikrishna Medical College & Hospital, Muzaffarpur, Bihar, India.

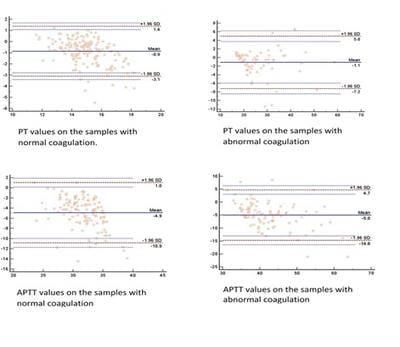
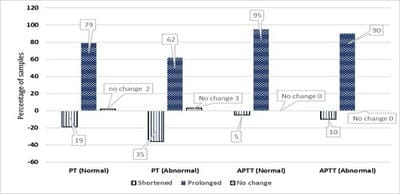
Background: Rejection of hemolysed samples for coagulation test is the standard practice. However, when clinicians deal with extremely sick patients where repeat sampling is difficult to obtain, rejection of the sample is a lost opportunity for the lab physician to assist inpatient care. Proceeding with the test and providing a clinically helpful interpretation of the results will ensure the active participation of the laboratory physician. Different principles of coagulation testing handle the hemolysed samples differently. It is essential to know the best principle to proceed with the hemolysed sample if need be. This study set out to estimate the predictive values of post-hemolytic sample coagulation test results with various coagulation test principles. Methods: This is a prospective experimental study where the non-hemolysed samples were processed for coagulation tests. Part of the sample was deliberately hemolysed, and the coagulation tests were repeated. Results: Two hundred and forty-eight samples were studied. A median of 11% hemolysis was achieved experimentally. The mean difference in prothrombin time between pre and post hemolytic samples with normal PT was 0.9 and with abnormal PT, it was 1.1 seconds. The same for APTT was 4.9 and 1.1 seconds, respectively. The majority of the samples showed prolonged coagulation post hemolysis. Positive (PPV) and negative (NPV) predictive values for prothrombin time are 97.3 and 73.4%, respectively. Similarly, PPV and NPV for APTT are 97.4 and 47.1%, respectively. Conclusions: Samples with normal values after hemolysis are more likely to be normal.

Keywords: Hemolysis, Prothrombin Time, Coagulation Tests, Partial Thromboplastin Time

Corresponding Author How to Cite this Article To Browse
Vani K, Associate professor, Department of Pathology, JSS Medical College, JSS Academy of higher education and research, Mysuru, Karnataka, India.
Email:
Vani K, Ahmad R. Comparison of various principles of coagulation tests in handling hemolysed blood samples. Trop J Pathol Microbiol. 2021;7(4):188-193.
Available From
https://pathology.medresearch.in/index.php/jopm/article/view/534

Manuscript Received Review Round 1 Review Round 2 Review Round 3 Accepted
2021-06-05 2021-06-10 2021-06-20 2021-06-30 2021-07-29
Conflict of Interest Funding Ethical Approval Plagiarism X-checker Note
No Nil Yes 5%

© 2021 by Vani K, Rubaiya Ahmad and Published by Siddharth Health Research and Social Welfare Society. This is an Open Access article licensed under a Creative Commons Attribution 4.0 International License https://creativecommons.org/licenses/by/4.0/ unported [CC BY 4.0].

Introduction

Coagulation testing is one of the frequently requested laboratory tests by the clinicians involved in the care of patients in intensive care units, obstetrics, surgery and those requiring anticoagulant or antithrombotic therapy. A standardized procedure of specimen collection and processing is the essential pre-analytical requirement to avoid hemolysis. [1]. The prevalence of haemolyzed specimens is as high as 3.3% of all the samples received in the clinical laboratory. [2,3]. Intensive care units are the most common source of a hemolysed sample [4].

According to one of the major surveys, hemolysis is the most frequent cause of sample rejection which is fivefold more frequent than low samples when coagulation tests are requested. [5,6]. Rejection of all hemolysed samples is the standard rule set by the manufacturers of the instruments and the reagents. The clinical and Laboratory Standards Institute recommends that samples with visible hemolysis be used because of possible clotting factor activation and endpoint measurement interference. [7]. However, rejections of these samples create a significant delay in patient management in the emergency department.

In addition, the extra cost is incurred per recollected specimen, adding to the overall cost of laboratory operation. [8]. It is not uncommon that resampling may not be possible due to the precarious condition of the patients and technical difficulty in obtaining blood samples. In such situations, clinicians would be immensely helped if the lab could provide the results with hemolysed samples with clinically useful interpretation. In this study, we set out to compare the ability of different principles of coagulation to identify clinically useful coagulation test results in deliberately hemolysed sample.

The study's primary objective was to compare the effect of hemolysis on prothrombin time and Activated partial thromboplastin between mechanical and optical principles of coagulation tests.

And secondary objectives were

  1. To estimate the agreement between the results of pre and post hemolytic samples
  2. To obtain the predictive values of the post hemolytic coagulation test results concerning the pre hemolytic results.

Method

Study Setting: This is an experimental study conducted in a tertiary care hospital in South India. The source of the sample was mainly from outpatient departments and intensive care units.

Study duration and type: The study was conducted over 18 months with data collected prospectively.

Sampling method: All consecutive samples obtained at the lab during normal working hours was collected.

Sample size: For a confidence level of 95%, power of 90%, alpha error of 5% to detect a difference of 10% between the pre and post hemolytic sample results as significant, we needed 211 samples.

Inclusion criteria: blood samples obtained from wards, ICUs and OPDs of our hospital were included in the study

Exclusion criteria: Samples obtained from the Neonatal intensive care unit were excluded

Procedure: Blood samples were collected in citrated vacutainers containing 3.2% sodium citrate for routine coagulation tests (PT and APTT). All the citrated non-hemolysed samples received by the laboratory within 2 hours from the time of phlebotomy were included in the study. Each sample was divided into two parts. Part 1 was centrifuged, and platelet-poor plasma was extracted. Prothrombin time (PT) and Activated partial thromboplastin time (APTT) was estimated by mechanical mode on Destiny plus. Part 2 of the sample was used for experimental hemolysis. The samples were hemolysed by repeated aspiration of entire blood into a syringe with a narrow bore needle (23 G) and pushing back to the same container five times.

Platelet poor plasma was extracted by centrifuging the sample. The samples were again rerun on the same instrument for PT and APTT. Laboratory reference range and target value for PT and APTT are set in our laboratory with each lot of the reagent by running the tests on an equal number of voluntary healthy males and females. The mean +/- 2 standard deviations is our laboratory reference range for that lot of the reagent. During this study, these values were 12.5 to 17 seconds for PT and 27-37 seconds for APTT. Optical mode on Destiny plus was used to obtain results via optical principles.


Statistical analysis: Quantitative variables were summarized as either mean and standard deviation or median and interquartile range as per the distribution pattern. Comparing the mean between two groups with continuous variables was done using Student's t-test. Descriptive categorical variables were reported as proportions. Predictive values were computed for the hemolysed sample. Agreement between the two results was analysed using Bland Altman analysis. Results were tabulated on Microsoft Excel and studied with Analyze-it for excel V4.3.
Ethics: This study was approved by the institutional ethical committee without the need for any special patient consent apart from consent for treatment already given.

Results

Two hundred and forty-eight samples received in the Hematology laboratory for coagulation testing were studied. 59% of the samples were from emergency and ICU wards, and 41% were from the outpatient department. 235 (94%) of the samples were from the adult population, and 15 (6%) were from Pediatrics. 247 (99%) samples were analysed for PT & INR, and 238 (95.2%) were analysed for APTT. The median age of our subjects was 40 years with an interquartile range between 25 and 50 years. Gender distribution was equal with a male to female ratio of 1:1. The median haemoglobin value before hemolysis was 12 gm/dl with an interquartile range (IQR) between 10.1 and 13.2gm/dl. The lowest haemoglobin in our study was 3.4 gm/dl, and the highest was 19.7 gm/dl. After haemolyzing the samples mechanically and later centrifuging them, the haemoglobin in the supernatant was quantified. The median haemoglobin value of the supernatant was 1.4 gm/dl. The estimated quantum of this hemolysis was a median of 11% and IQR between

7.8% and 18%. One hundred and seventy-four (70.2%) samples had normal prothrombin values, and 137 (57.5%) had normal APTT values. Coagulation tests on optical principle in the post haemolysis sample were largely unsuccessful, with only 24 (9.6%) samples yielding results. Hence the comparison of post haemolytic samples was made on values obtained by the mechanical method alone. The results [Median, (IQR)] of mechanical and optical principles of coagulation tests in the pre-hemolysed samples yielded, Prothrombin time (in seconds) of 15.1(13.9–18.7) and 15.2(14–18.6), INR of 1.08(0.97–1.4) and 1.09(0.98–1.39), APTT (in seconds) of 32.1(29–37.1) and 32.3(28.9–35.9) respectively. The difference was not significant. The mean difference between the pre and post hemolytic samples for prothrombin time was 1.2 seconds, with lower pre hemolytic values. In the group who had normal PT (<17 seconds), the mean difference between pre and post hemolytic samples was 0.9 seconds (95% limit of agreement -3.1 to +1.4 seconds). For the samples which had abnormal PT (> 17 seconds), the mean difference was 1.1 (95% limit of agreement -7.2 to +5) seconds. The mean difference between PT values for both normal and abnormal groups was not statistically significant. INR followed a similar trend. The mean difference between the pre and post hemolytic samples for APTT was 5 seconds, with lower pre hemolytic values. In the group who had normal APTT (<37 seconds), the mean difference between Pre and post hemolytic samples was 4.9 seconds (95% limit of agreement -1 to +10.9 seconds). For the samples which had abnormal APTT (> 37 seconds), the mean difference was 1.1 (95% limit of agreement -14.8 to +4.7) seconds. The mean difference between normal and abnormal APTT groups was statistically significant (Table 1).


Table 1: Comparison of the Pre and Post hemolytic coagulation test values

Coagulation test Pre-Hemolysis Mean (SD) Post-Hemolysis Mean (SD) Mean difference P value*
PT (Normal) 14.4 (1.2) 15.3 (1.7) 0.9 0.134
PT (Abnormal) 26.5 (9.6) 27.6 (9.6) 1.1 0.722
APTT (Normal) 29.3 (2.5) 34.2 (3.8) 4.9 0.0001
APTT (Abnormal) 39.7 (6) 44.7 (8.1) 5 0.0001
*Student 't' Test

The Bland Altman graphs for agreement between the pre and post hemolysis parameters are depicted in Figure 1.

Figure 1: Bland Altman plots for agreement of pre and post hemolysis parameters


patho_534_01.jpg

The effect of hemolysis on the coagulation time was predominantly to prolong coagulation (Figure 2).

Figure 2: Direction of change in the coagulation results post hemolysis

patho_534_02.jpg

A shortened coagulation time in post hemolytic sample, if it was normal before hemolysis, does not make any clinical difference. Similarly, prolongation of the coagulation time, if it is already abnormal, makes no difference for the clinician. Hence, a clinically significant value is the predictive ability of the test. We found both PT and APTT in post hemolytic samples had a remarkably high positive predictive value of >97%. The conversely negative predictive value was only moderate for PT and poor for APTT (Table 2)

Table 2: Predictive values of post hemolytic coagulation test results

Prothrombin time Pre-normal Pre-abnormal Total Predictive values
Post-normal 149 (85.6%) 4 (5%) 153 PPV - 97.3%
Post-abnormal 25 (14.4%) 69 (95%) 94 NPV – 73.4%
Total 174 73    
APTT
Post-normal 154 (78.5%) 0 (0%) 154 PPV - 100%
Post-abnormal 42 (21.5%) 42 (100%) 84 NPV - 50%
Total 196 42    
Pre = Pre-hemolysis, Post = Post Hemolysis, PPV = Positive predictive value, NPV = Negative predictive value, APTT = Activated partial thromboplastin time

In our pilot study, we found the variation in the results of both PT and APTT when performed repeatedly from the same sample was minimal and did not exceed 10%. Hence, we estimated the proportions of samples in this study with more than 10% variation post hemolysis. Twenty-four percent of the Normal PT samples,4% of samples with abnormal PT, had a variation of more than 10% from baseline value post hemolysis. Seventy percent of samples with normal APTT and 3% with abnormal APTT had more than 10% variation post hemolysis 85.7% of PT values before hemolysis remained normal, and 14.3% reported abnormal results after hemolysis.

95% of abnormal PT values before hemolysis remained abnormal, and only 5% reported normal PT values after hemolysis. The results with APTT were not so encouraging. Only 64.1% of samples that had normal APTT before hemolysis remained normal. Conversely, 95% of samples that had abnormal APTT before hemolysis remained abnormal post hemolysis as well.

Discussion

Our study shows that the coagulation results of hemolysed samples vary significantly compared to non-hemolytic samples and hence remain inferior to proceed with coagulation tests. The optical principle of coagulation testing is not suitable for hemolysed samples. Results obtained by mechanical principle should be used with utmost caution in case of emergency. The mean values of PT, pre and post hemolysis have shown minimal difference, which is statistically insignificant. In a study like the present one, Arora et al. [9]. have compared the summarised values of pre and post hemolytic samples, which have yielded similar results as ours.

However, in this scenario, we believe a simple comparison of summarised data results in gross generalization. The sample size in the above study is too small to make these results usable. Nevertheless, they have shown a direction to proceed with hemolytic samples. The positive predictive values for PT and APTT are relatively high, making it reasonable to interpret normal values. The clinician may use a normal value on the hemolysed sample to make appropriate management decisions with a risk of being wrong is less than 5%.


The effect of hemolysis is predominantly to prolong the coagulation time, as noted in our study. This bolsters the above argument. The same cannot be said about the abnormal results. Our result follows the survey done by Laga A C et al. [10], which showed in vitro haemolysis prolonging the APTT. However, they have not mentioned the mode of coagulometry used in their study. We noted that the coagulation tests are predominantly prolonged. A similar trend has been reported in several other studies. [9-11]. The theory behind the recommendation to reject hemolysed samples from processing is that the coagulation factors could have been already activated and hence shortened the estimated time by the laboratory.

This is contrary to our finding where the most common effect of hemolysis on coagulation was to prolong the process and not hasten it. It is shown that certain cellular elements can retard the process of coagulation. [11]. this is evident in our study as the majority of the samples showed retarded coagulation. It might be reasonable to hypothesize that hemolysis releases both stimulant and retardant elements into the plasma. The result depends on which side the balance tilts in each sample.

There appears to be a good agreement between the PT values of pre-and post-haemolysis. For the samples with normal coagulation, the average mean difference was 0.9 seconds and 1.1 seconds for abnormal coagulation. Both these values are well within the priory agreed 10% of baseline value and supports considering hemolysed samples for analysis of prothrombin time. However, 95% limits of agreement for samples with abnormal coagulation had a more comprehensive range. This necessitates caution while interpreting the values which are close to the upper limit of normal. Overall, these results imply that Hemolysed samples could be considered for further analysis in case of clinical emergency only. Similar inferences were drawn in other studies as well. [9-11].

The agreement between the values for APTT in both normal and abnormal group is quite comprehensive and appear non-usable at initial instance. However, it is important to remember that in coagulation tests, the results in binary are all that is required in most clinical instances, except for patients who have their medications titrated, depending on the outcome. This provides an opportunity to view our results from a more clinically helpful perspective.

Our study shows that a prolonged APTT due to basic pathology is less likely to produce normal results if hemolysed. In summary, a normal coagulation test results in a hemolysed sample more likely to indicate normal coagulation. Very much prolonged coagulation results in the hemolysed sample, less likely to show normal coagulation.

A result in the upper limit of normal and not very prolonged is equivocal and hence not interpretable limitation of the study. The in-vitro haemolytic procedure we have adopted have resulted in significant hemolysis, which might be way higher than seen in a real-life scenario.

Conclusions

Hemolytic samples will interfere to a variable extent in coagulation studies. The optical principle is unsuitable for processing these samples. Prothrombin time is less affected when compared to activated partial thromboplastin time. The influence of haemolysis on prothrombin time is minimal and still makes it clinically usable.

However, in cases of deranged coagulation, the prothrombin time should be cautiously interpreted. Activated partial thromboplastin time is strongly influenced by haemolysis. In cases of prolonged coagulation, APTT values of hemolysed samples could be still representative of actual coagulation status.

In precarious situations where the patient is extremely sick with prolonged coagulation and repeat sample is difficult to obtain, this information could be helpful.

Author's contribution

Dr VK constructed the research question, did the study design and data analysis. Dr RA collected the data, did the literature search, and prepared the initial manuscript. Both authors contributed to finetuning the manuscript and approved it in its present form for submission

What does this study add?

In the case of hemolysed samples, the mechanical method of coagulation analysis is suitable for processing the sample. Prothrombin time obtained by this method is clinically usable in precarious situations. Activated partial thromboplastin time is not to be reported in this sample.


Reference

01. Lippi G, Plebani M, Favaloro EJ. Interference in coagulation testing: focus on spurious hemolysis, icterus, and lipemia. Semin Thromb Hemost. 2013 Apr;39(3):258-66. doi: 10.1055/s-0032-1328972 [Crossref][PubMed][Google Scholar]

02. Carraro P, Servidio G, Plebani M. Hemolysed specimens: a reason for rejection or a clinical challenge?. Clin Chem. 2000 Feb;46(2):306-7. [Crossref][PubMed][Google Scholar]

03. Heyer NJ, Derzon JH, Winges L, Shaw C, Mass D, Snyder SR, et al. Effectiveness of practices to reduce blood sample hemolysis in EDs: a laboratory medicine best practices systematic review and meta-analysis. Clin Biochem. 2012 Sep;45(13-14):1012-32. doi: 10.1016/j.clinbiochem. 2012.08.002 [Crossref][PubMed][Google Scholar]

04. Lippi G, Plebani M, Di Somma S, Cervellin G. Hemolysed specimens: a major challenge for emergency departments and clinical laboratories. Crit Rev Clin Lab Sci. 2011 May-Jun;48(3):143-53. doi: 10.3109/10408363.2011.600228 [Crossref][PubMed][Google Scholar]

05. Plebani, Mario. "Errors in clinical laboratories or errors in laboratory medicine". Clinical Chemistry and Laboratory Medicine (CCLM). 44;6(2006): 750-759. [Crossref][PubMed][Google Scholar]

06. Carraro P, Servidio G, Plebani M. Hemolysed specimens: a reason for rejection or a clinical challenge?. Clin Chem. 2000 Feb;46(2):306-7. [Crossref][PubMed][Google Scholar]

07. Arkin, Charles F. Collection, Transport, and Processing of Blood Specimens for Testing Plasma Based Coagulation Assays: Approved Guideline. NCCLS. 2003. [Crossref][PubMed][Google Scholar]

08. Bodansky DMS, Lumley SE, Chakraborty R, Mani D, Hodson J, Hallissey MT, Tucker ON. Potential cost savings by minimization of blood sample delays on care decision making in urgent care services. Ann Med Surg (Lond). 2017 Jun 16;20:37-40. doi: 10.1016/j.amsu.2017.06.016 [Crossref][PubMed][Google Scholar]

09. Arora S, Kolte S, Dhupia J. Hemolysed Samples Should be Processed for Coagulation Studies: The Study of Hemolysis Effects on Coagulation Parameters. Ann Med Health Sci Res. 2014 Mar;4(2):233-7. doi: 10.4103/2141-9248.129049 [Crossref][PubMed][Google Scholar]

10. Laga AC, Cheves TA, Sweeney JD. The effect of specimen hemolysis on coagulation test results. Am J Clin Pathol. 2006 Nov;126(5):748-55. doi: 10.1309/03FK-3378-YTRA-1FRF [Crossref][PubMed][Google Scholar]

11. Lippi G, Montagnana M, Salvagno GL, Guidi GC. Interference of blood cell lysis on routine coagulation testing. Arch Pathol Lab Med. 2006 Feb;130(2):181-4. doi: 10.5858/2006-130-181-IOBCLO [Crossref][PubMed][Google Scholar]