E-ISSN:2456-1487
P-ISSN:2456-9887
RNI:MPENG/2017/70771

Research Article

Staphylococcus Aureus

Tropical Journal of Pathology and Microbiology

2023 Volume 9 Number 4 October-December
Publisherwww.medresearch.in

Inducible Clindamycin Resistance among Clinically Significant Staphylococcus Aureus Isolates in a Tertiary Care Centre

Sadanandan N1*
DOI:https://doi.org/10.17511/jopm.2023.i04.01

1* Nisha Sadanandan, Assistant Professor, Department of Microbiology, Sree Narayana Institute of Medical Sciences, Ernakulam, Kerala, India.

Objective: Staphylococcus aureus isolates with inducible clindamycin resistance may lead to therapeutic failure in treating with Clindamycin. Aim: To detect inducible clindamycin resistance of clinically significant Staphylococcus aureus isolates and MIC of clindamycin in them. Study design: Crossectional study. Study subjects: The study was conducted in 200 clinically significant Staphylococcus aureus isolates from Govt Medical College, Thrissur Kerala, India over one year. Study methods: A d test was done and iMLSB, cMLSB, and MS phenotypes were identified. An epsilometer test was done to determine the MIC of Clindamycin. Statistical analysis was done using the IBM Statistical Package for Social Sciences version 25(SPSS). Results: Of the total 200 samples 132(66%) were MSSA and 68(34%) were MRSA.MS phenotypes 60(30%), iMLSB phenotype 53(26.5%),cMLSB phenotype 44 (22%), Erythromycin and Clindamycin sensitive strains 41(20.5%) and resistant strains 2 (1%). Inducible and constitutive resistance to clindamycin was more in MRSA.92% of iMLSB phenotypes and 96% of MS phenotypes had MIC < 0.5(sensitive). 8% of iMLSB phenotypes and 96% of cMLSB phenotypes had MIC >4(resistant). One isolate with cMLSB phenotype had MIC in the intermediate range. Conclusion: The prevalence of inducible clindamycin resistance in our hospital is high and more common among MRSA. E test helped to determine MIC in the intermediate range (shown by cMLSB phenotype )which is not possible by doing the disc diffusion method alone. The most common phenotype isolated was the MS phenotype.

Keywords: iMLSB, cMLSB, MS Phenotype, D test, MRSA, MSSA, MIC

Corresponding Author How to Cite this Article To Browse
Nisha Sadanandan, Assistant Professor, Department of Microbiology, Sree Narayana Institute of Medical Sciences, Ernakulam, Kerala, India.
Email:
Sadanandan N. Inducible Clindamycin Resistance among Clinically Significant Staphylococcus Aureus Isolates in a Tertiary Care Centre. Trop J Pathol Microbiol. 2023;9(4):32-39.
Available From
https://pathology.medresearch.in/index.php/jopm/article/view/631

Manuscript Received Review Round 1 Review Round 2 Review Round 3 Accepted
2023-12-07 2023-12-09 2023-12-16 2023-12-23 2023-12-30
Conflict of Interest Funding Ethical Approval Plagiarism X-checker Note
Nil Nil Yes 16%

© 2023by Sadanandan Nand Published by Siddharth Health Research and Social Welfare Society. This is an Open Access article licensed under a Creative Commons Attribution 4.0 International License https://creativecommons.org/licenses/by/4.0/ unported [CC BY 4.0].

Introduction

Staphylococcus aureus is one of the most common bacteria infecting man. It can cause minor skin infections to severe life-threatening conditions like septicemia, endocarditis and pneumonia.[1] Staphylococcus aureus is the second most common cause of nosocomial bacteremia and an important cause of nosocomial infection associated with indwelling medical devices. About 20-30% of the population are carriers of Staphylococcus aureus and it colonizes almost all parts of our body. [2] Methicillin resistance is the most important drug resistance mechanism in Staphylococcus aureus. The macrolide-lincosamide --streptogramin B (MLS B) antibiotics serve as a reserve drug for treating Staphylococcal infections, with clindamycin being the preferred agent due to its excellent pharmacokinetics. Its ability for tissue penetration and ability to accumulate in abscesses make it suitable for treating skin and soft tissue infections. Another advantage of this drug is that no renal dose adjustments are needed and can be given to patients allergic to Penicillin. [3] But their overuse can cause resistance to MLS antibiotics.[4]

Clindamycin acts by inhibiting protein synthesis. It can suppress the expression of virulence factors in Staphylococcus aureus at sub-inhibitory concentrations (sub-MICs). It decreases the production of Panton-Valentine leucocidin (PVL), toxic-shock-staphylococcal toxin (TSST-1) or alpha-haemolysin (Hla) at sub-inhibitory concentrations. So recent guidelines recommend clindamycin for the treatment of toxin-mediated infections.[5]

Staphylococcal resistance to clindamycin may be inducible (iMLSB- inducible Macrolide-Lincosamide-StreptograminB resistance) or constitutive. Bacterial resistance to this group may be expressed through different mechanisms including target modification, macrolide efflux pump and enzymatic antibiotic inactivation.[6]

The erm genes encode modification of the ribosomal target by methylation of 23s rRNA binding sites which prevents bonding of the drug to the target site. [7] The erm gene encodes for inducible and constitutive resistance. MS phenotype is encoded by the msrA gene.[8]

If the bacterial isolate possesses a constitutive resistance phenotype, they have a consistent expression of the erm gene.

These isolates show in vitro resistance to erythromycin, clindamycin and other members of MLS. In the case of inducible resistance, an inducing agent for the erm gene is needed to express resistance to Clindamycin. Erythromycin can act as a strong inducer of methylase synthesis.

It is noted that in patients possessing iMLSB phenotype treatment with clindamycin subsequently leads to clinical failure. [9] Moreover, clindamycin is an underutilized drug and knowledge of its resistance pattern helps to formulate empirical therapy in bone and soft tissue infections.

Another type of macrolide resistance shown by Staphylococcus aureus is due to the efflux pump. It is encoded by the msrA gene. This will result in macrolide and Type B streptogramin resistance but not resistance to lincosamide. They are called MS phenotypes which show resistance to erythromycin and susceptibility to Clindamycin in vitro. clindamycin can be safely administrated for this type of isolate without any therapeutic failure. So it is important to differentiate between phenotypes with inducible clindamycin resistance and MS phenotypes.[9]

This study aims to detect inducible clindamycin resistance among clinically significant Staphylococcus aureus isolates by double disk diffusion test(D test) and to determine the MIC of clindamycin in Staphylococcus aureus isolates.

Materials and Methods

A cross-sectional study was done in the Department of Microbiology over a year. All Staphylococcus aureus isolated in our laboratory from clinical samples like pus, blood, wound swabs, ear swabs and body fluids were included. Isolates from urine samples and patients who are already on treatment with Clindamycin were excluded. The sample size of the study was calculated as 200.

Staphylococcus aureus isolates will be identified by standard microbiological methods. Isolates were taken only from clinically significant samples. Clinical significance is assessed by analyzing the clinical history of the patient. Appropriately collected samples were included in the study by checking the gram stain of the sample. The presence of pus cells and gram-positive cocci in the smear is taken as an indication of infection.


Gram stain taken from the isolated colonies on blood agar. The colonies were smooth, convex, glistening, and opaque on blood agar. Gram stain showed Gram-positive cocci arranged in clusters were subjected to catalase test, tube coagulase and slide coagulase test to confirm it as Staphylococcus aureus.

Antibiotic susceptibility testing is done by Kirby Bauer's disk diffusion method on Mueller Hinton agar plates as per CLSI guidelines. Methicillin resistance was detected using cefoxitin disks (30µg). Zone size greater than or equal to 22 mm is considered as MSSA and less than or equal to 21 mm is taken as MRSA. Erythromycin-resistant isolates were further subjected to the 'D test'.

D test

A clindamycin disk (2µg) is placed at a distance of 15mm (edge to edge) from the erythromycin disk (15µg) on Mueller Hinton agar plates. After incubation of 16-18 hours, there will be D shape flattening of the zone occurs in between the Erythromycin and Clindamycin discs. This indicates inducible clindamycin resistance. [3] By this method, we can distinguish constitutive resistance from inducible resistance.[10]

From the D test, the following phenotypes were identified:

1. iMLSB phenotype: S. aureus isolates showed resistance to erythromycin (zone size ≤13 mm) while being sensitive to clindamycin (zone size ≥21 mm) and a D-shaped zone of inhibition around clindamycin with flattening towards erythromycin disc (D test positive).[11]

2. cMLSB phenotype: S. aureus isolates showed resistance to both erythromycin (zone size ≤13 mm) and clindamycin (zone size ≤14mm) with a circular shape zone of inhibition around clindamycin. [10]

3. MS phenotype: S. aureus isolates exhibiting resistance to erythromycin (zone size ≤13 mm), while sensitive to clindamycin (zone size ≥21 mm) and have a circular zone of inhibition around clindamycin (D test negative). [10]

4. Sensitive phenotype: S. aureus isolates exhibiting resistance to erythromycin (zone size ≥23 mm), while sensitive to clindamycin (zone size ≥21 mm) and have a circular zone of inhibition around clindamycin (D test negative).[3]

Statistical analysis was done by chi-square test and P value was calculated. A p-value less than 0.05 is considered as significant.

E test

Manual in vitro diagnostic device used to determine MIC. It is a ready-to-use, inert and non-porous plastic reagent strip with a predefined gradient of antibiotic. E strip test was done to determine the MIC of Clindamycin.

Procedure

Emulsified well-isolated test strain colonies from an overnight incubated agar plate in saline. Adjusted the turbidity of suspension to 0.5 McFarland standard. A sterile cotton swab is soaked in inoculum suspension. Streaked a lawn culture of Staphylococcus aureus in Mueller Hinton agar. The Clindamycin E strip was placed and incubated overnight. An elliptical zone of growth inhibition is obtained after incubation and MIC is read where the ellipse intersects the strip.

According to CLSI guidelines, MIC values less than or equal to 0.5 are considered sensitive, isolates with values between 1 and 2 have intermediate resistance and those with MIC values greater than 4 are resistant.

Data was analyzed by using IBM Statistical Package for Social Sciences version 25 (SPSS). The p-value less than 0.05 is taken as statistically significant.     

patho_631_01.JPG
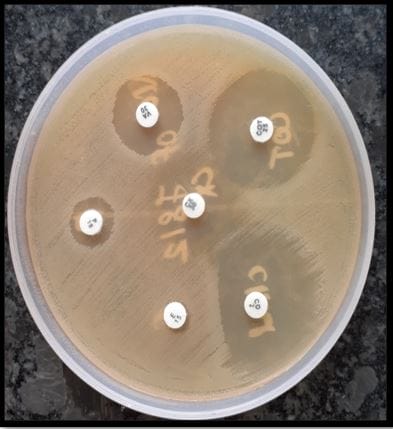
Figure no 1: D Test Positive


patho_631_02.JPG
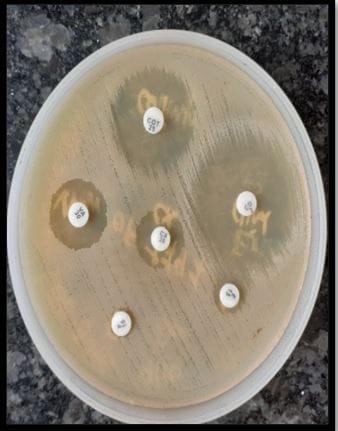
Figure no 2: MS Phenotype

patho_631_03.JPG
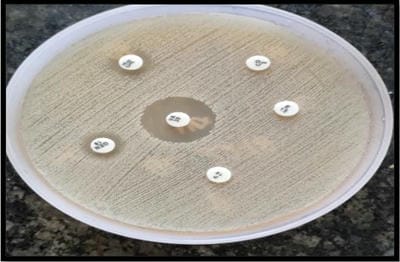
Figure no 3: Constitutive Resistance

Results

In the present study, most of the isolates are from patients between 46 years to 60 years (30%), followed by more than 60 years (20%),31-45years (18%),1-15years (16.5%) and 16-30 years (15.5%). The increased number of isolates from above 46 years of age, may be due to increased comorbidities. In total 200 samples 56% from male patients and the remaining 44% from female patients. Of the total 200 samples, the majority was pus swabs 107 (53.5%), then pus aspirate 42(21%), blood sample 41(20.5%), Tissue specimen 6 (3%) and sputum

samples 4(2%).132 isolates among 200 (66%) were MSSA and 68 (34%) MRSA

D test was done for 157 samples with erythromycin resistance. 53 of them were D test positive (26.5% of total samples). MS phenotypes were predominating 60(30%), followed by iMLSB phenotype 53(26.5%), then comes cMLSB 44 (22%), Erythromycin and clindamycin sensitive strains 41(20.5%) and finally erythromycin sensitive and clindamycin resistant 2 (1%) phenotype.

Table 1: Percentage of different phenotypes

PhenotypeFrequencyPercentage
iMLSB5326.5%
cMLSB4422.0%
MS phenotype6030.0%
Erythromycin and Clindamycin Sensitive4120.5%
Erythromycin(S), clindamycin(R)21.0%
Total200100.0%

The prevalence of distribution of different phenotypes among different ages is statistically compared. (P=0.595). There was no significant difference in the distribution of different phenotypes among different age groups.

The distribution of different phenotypes among males and females is analyzed and statistically compared (P=0.543). No significant relationship can be observed.

Among 200 samples pus swab 38(35.5%) and pus aspirate 13(31%) yielded a maximum percentage of iMLSB phenotypes. It was statistically tested and found to be significant. (P=0.005)

iMLSB phenotype was more among MRSA isolates (30.9%) than MSSA(24.6%). cMLSB phenotype was more among MRSA(38.2%) than MSSA(13.8%).MS phenotypes were higher in MSSA(32.3%) than in MRSA (26.5%). Sensitive strains are more common in MSSA(29.2%) than MRSA(4.4%).

Out of the total 200 isolates, 100 isolates were subjected to E test to determine MIC of clindamycin isolates with inducible clindamycin resistance (25), constitutive resistance (25), MS phenotypes (25) and both erythromycin and clindamycin sensitive isolates (25) were tested. 24 (96%) of out of 25 MS phenotype isolates have MIC less than 0.5(sensitive) and 1 (4%) have MIC in the resistant range.


Among isolates with inducible clindamycin resistance 23 ( 92%) are in the sensitive range and 2 (8%) in the resistant range. 24 (96%) cMLSB phenotypes have MIC>4 and 1 (4%) among them have MIC in the intermediate range.

All isolates with erythromycin and clindamycin sensitivity have MIC in the sensitive range.

Table 2: MIC of clindamycin in different phenotype

MIC Range in µg/mliMLSB (%)cMLSB (%)MS phenotype (%)Erythromycin&clindamycin sensitive
<=0.5(sensitive)23 (92%) -24(96%)25 (100%)
1-2 (intermediate) -1(4%) - -
>=4 (resistant)2 (8%)24(96%)1(4%) -

Discussion

From this study, it is evident that the prevalence of Clindamycin resistance is increasing in our Hospital. In the present study isolates from pus swabs and pus aspirate possess more iMLSB phenotype than blood, sputum and tissue isolates.

Among 200 isolates of Staphylococcus aureus 68(34%) were MRSA and 132 (66%) were MSSA which is comparable with the study by Fasih et al. [9], Anu Sharma et al [13], Jayachandiran et al [14]

In the majority of studies number of MSSA isolates is more than MRSA. Prakash et al [15 ]and Mamma et al [16] reported more MRSA than MSSA.

On comparing the distribution of iMLSB, cMLSB and MS phenotype in the present study with other studies, isolates with erythromycin sensitivity and clindamycin resistance were found in 2(1%) which is consistent with the study conducted by Prakash et al. [15]

In this present study, 53 isolates that are 26.5% of the total isolates have iMLSB phenotype which is comparable with the study by Kale et al [17] (26.8%) and Mamma et al (24.1%) [16].

In the present study, 44 isolates (22%) have cMLSB phenotype which nearly comes to the study by Anu Sharma et al (20.44%). [13] In the present study, the MS phenotype predominates over the iMLSB phenotype and cMLSB phenotype which is comparable with a study by Regha et al [18] and Lyall et al. [10]

But in a study by Kale et al and Fathima et al cMLSB phenotype is predominant. [17,19] In a study by Regha et al [18] states that the incidence of these phenotypes varies with geographical areas, study population and hospital epidemiology. This may be the reason for such a finding.

From the above table, it is clear that in the majority of studies, MRSA possesses more inducible clindamycin resistance than MSSA. On the contrary in a study conducted by Lyall et al [12], MSSA possesses more iMLSB phenotype than MRSA. In the present study among 53 isolates with positive D test 21 were MRSA and 32 were MSSA. It is statistically compared and found out there is a significant increase in inducible clindamycin resistance among MRSA (P=<0.01). This can be explained by the fact that multiple antibiotic resistance is seen in MRSA than in MSSA.

MS phenotypes show true sensitivity to clindamycin. The incidence of MS phenotypes is higher in MSSA than in MRSA.[12] It is comparable to the study done by Ghogare et al [20], Veena Manjunath et al [ 21] and Sreenivasalu et al [22]. MS phenotype is determined by the msrA gene. Here, resistance occurs due to the efflux mechanism which pumps out 14 and 15-membered macrolides and streptogramin B. These strains are resistant to erythromycin, but sensitive to clindamycin in vitro and in vivo. So clindamycin can be used for treatment.

In the present study, it was found that constitutive resistance was more common among MRSA than MSSA. (P<0.01). It can be explained by the fact that the prevalence of resistance to antibiotics other than methicillin is also higher in MRSA.

In Siberry et al in pediatric patients the proportion of isolates with in vitro iMLSB was significantly higher among MSSA that had discordant erythromycin/clindamycin susceptibility than it was among discordant MSSA isolates from adult patients. [33] In the present study, there were no significant differences (P=0.595) in the distribution pattern of different phenotypes between adult and pediatric populations. From this study, it is clear that methicillin resistance and clindamycin resistance are increasing in the pediatric population too. Clindamycin is commonly used for bone, skin and soft tissue infections in children. The iMLSB phenotype can result in the therapeutic failure of clindamycin.


In the present study, 92% of iMLSB phenotypes and 96% of isolates with MS phenotype have MIC less than 0.5 which is in the sensitive range according to CLSI guidelines. 2 (8%) isolates with iMLSB phenotypes and 24(96%) of isolates with constitutive resistance have MIC greater than 4 which indicates resistance. One isolate with constitutive resistance has MIC in an intermediate range that is between 1 and 2. Erythromycin and clindamycin-sensitive isolates have MIC in the sensitive range.

E test could not help us to differentiate between inducible and constitutive resistance. However, it helps to determine intermediate resistance to Clindamycin which will not be possible by the disc diffusion method [29]. In the present study, intermediate resistance was obtained only for one isolate.

In the present study, 96% of MS phenotype isolates have MIC less than 0.5 which means they are sensitive. In the study done by Fathima Khan et al, all isolates with MS phenotype have MIC less than 0.5.[19]A study by Sireesha and Setty in 2012 demonstrated the MIC of clindamycin to be more than 128 μg/ml in all the MS phenotypes which they attributed to heteroresistance or some other unknown mechanism. [23]

In isolates with inducible clindamycin resistance, 92% are in the sensitive range and 2% in the resistant range. In a study conducted by Sireesha et al [23], 66.6% were in the sensitive range and 33.3% in the resistant range. Since we are not using any inducer, this resistance may be due to some other mechanisms. Mutations can occur spontaneously which will transform iMLSB strains to cMLSB phenotype without the presence of a macrolide inducer during clindamycin therapy. [15]

MIC values of MRSA and MSSA isolates with inducible clindamycin resistance showed no significant differences. 96 % of isolates with cMLSB phenotype had MIC in the resistant range and 4% with the intermediate range, which is following the study by Fathima Khan et al, 86% cMLSB phenotype in the resistant range and 14% in the intermediate range. [19]

Conclusion

Among 200 isolates 26.5% showed inducible clindamycin resistance.

This study revealed that there is an increased prevalence of Inducible clindamycin resistance in our hospital .22% of isolates have constitutive resistance to Clindamycin and Erythromycin. The most common phenotype isolated in the present study was the MS phenotype. 66% of total isolates were MSSA and 34% were MRSA. Clindamycin-resistant phenotypes (inducible and constitutive) were more common among MRSA and clindamycin-sensitive phenotypes were more common in MSSA isolates.

In 53 samples with inducible clindamycin resistance, 92% of isolates have MIC in the sensitive range and 8% in the resistance range. MIC determination did not provide any added advantage in identifying iMLSB phenotypes.

E test helped to determine MIC in an intermediate range which is not possible by doing the disc diffusion method alone. Isolates from pus samples possess more iMLSB phenotype. There was no significant difference in the distribution pattern of different phenotypes between adult and pediatric populations. Methicillin resistance and Clindamycin resistance are increasing in the pediatric population too. No significant difference in the prevalence of inducible clindamycin resistance between males and females. Double Disc diffusion test with Erythromycin and Clindamycin should be done before starting clindamycin therapy to prevent therapeutic failure.

References

1. Baral R, Khanal B. Inducible clindamycin resistance in Staphylococcus aureus strains isolated from clinical samples. International Journal of Biomedical Research. 2017 Feb 28;8(2):81-4. [Crossref][PubMed][Google Scholar]

2. Regmi RS, Khadka S, Sapkota S, Magar ST, Adhikari S, Subedi S, Shrestha P, Rana JC. Phenotypic detection of inducible clindamycin resistance among clinical isolates of Staphylococcus aureus in Bharatpur hospital. Journal of College of Medical Sciences-Nepal. 2020 Sep 30;16(3):178-83. [Crossref][PubMed][Google Scholar]

3. Kavitha AV. Inducible clindamycin resistance among Staphylococcus aureus isolates from various clinical samples. University Journal of Pre and Paraclinical Sciences. 2020 Dec 30;6(8). [Crossref][PubMed][Google Scholar]


4. Thapa D, Pyakurel S, Thapa S, Lamsal S, Chaudhari M, Adhikari N, Shrestha D. Staphylococcus aureus with inducible clindamycin resistance and methicillin resistance in a tertiary hospital in Nepal. Tropical Medicine and Health. 2021 Dec;49(1):1-7. [Crossref][PubMed][Google Scholar]

5. Hodille E, Badiou C, Bouveyron C, Bes M, Tristan A, Vandenesch F, Lina G, Dumitrescu O. Clindamycin suppresses virulence expression in inducible clindamycin-resistant Staphylococcus aureus strains. Annals of clinical microbiology and antimicrobials. 2018 Dec;17(1):38. [Crossref][PubMed][Google Scholar]

6. Mahfouz AA, Said HS, Elfeky SM, Shaaban MI. Inhibition of Erythromycin and Erythromycin-Induced Resistance among Staphylococcus aureus Clinical Isolates. Antibiotics. 2023 Mar 2;12(3):503. [Crossref][PubMed][Google Scholar]

7. Garg S, Mahajan RK, Chhakchhuak Z, Tluanpuii V Clindamycin. An adjunct option in drug-resistant staphylococcal infections. CHRISMED Journal of Health and Research. 2022 Oct 1;9(4):242-5. [Crossref][PubMed][Google Scholar]

8. Moosavian M, Shoja S, Rostami S, Torabipour M, Farshadzadeh Z. Inducible clindamycin resistance in clinical isolates of Staphylococcus aureus due to erm genes, Iran. Iran J Microbiol. 2014 Dec;6(6):421-7. PMID: 25926961; PMCID: PMC4411429 [Crossref][PubMed][Google Scholar]

9. Fasih N, Irfan S, Zafar A, Khan E, Hasan R. Inducible clindamycin resistance due to expression of erm genes in Staphylococcus aureus: report from a tertiary care hospital Karachi, Pakistan. Journal of the Pakistan Medical Association. 2010;60(9):750. [Crossref][PubMed][Google Scholar]

10. Lyall KS. Guptha V,Chhina D. Inducible clindamycin resistance among clinical isolates of Staphhylococcus aureus. J Mahatma Gandhi Inst Med Sci 2013;18:112-5. [Crossref][PubMed][Google Scholar]

11. Ghanbari F, Ghajavand H, Havaei R, Jami MS, Khademi F, Heydari L, Shahin M, Havaei SA. Distribution of erm genes among Staphylococcus aureus isolates with inducible resistance to clindamycin in Isfahan, Iran. Advanced biomedical research. 2016;5. [Crossref][PubMed][Google Scholar]

12. Gangurde N, Bajaj P, Phatale S. Prevalence of inducible clindamycin resistance among staphylococcus aureus isolates in a tertiary care hospital: an alarm before “no antibiotic era”. Journal of Evolution of Medical and Dental Sciences. 2014 May 5;3(18):4839-47. [Crossref][PubMed][Google Scholar]

13. Sharma A, Sharma RP, Bhise M, Shaikh NK. Inducible Clindamycin resistance among clinical isolates of Staphylococcus aureus from a tertiary care teaching hospital in Solapur, Maharashtra. Indian Journal of Applied Research. 2019 Aug 12;9(7). [Crossref][PubMed][Google Scholar]

14. Jayachandiran AL, Kandasamy B, Vilwanatha S, Muralidharan V. A Study of Inducible Clindamycin Resistance among Staphylococcus aureus Skin and Soft Tissue Infections in A Tertiary Care Hospital. Journal of Microbiology and Infectious Diseases. 2019 Sep 1;9(03):125-8. [Crossref][PubMed][Google Scholar]

15. Sah P, Khanal R, Lamichhane P, Upadhaya S, Lamsal A, Pahwa VK. Inducible and constitutive clindamycin resistance in Staphylococcus aureus: An experience from Western Nepal. Int J Biomed Res. 2015;6:316-9. [Crossref][PubMed][Google Scholar]

16. Mama M, Aklilu A, Misgna K, Tadesse M, Alemayehu E. Methicillin-and Inducible Clindamycin-Resistant Staphylococcus aureus among Patients with Wound Infection Attending Arba Minch Hospital, South Ethiopia. International journal of microbiology. 2019;2019. [Crossref][PubMed][Google Scholar]

17. Kale S, Patil A. The study of inducible and constitutive clindamycin resistance in Staphylococcus aureus isolates from clinical samples in a teriary care hospital in central india. International Journal of Scientific Research. 2019 Jul 17;8(4). [Crossref][PubMed][Google Scholar]

18. Regha IR, Harichandran D, Sulekha B. Inducible Clindamycin Resistance among Clinical Isolates of Staphylococcus aureus in a Tertiary Care Centre, Kerala, India. Int J Curr Microbiol App Sci. 2016;5(4):929-34. [Crossref][PubMed][Google Scholar]

19. Khan F, Ali S, Sultan A, Rizvi M, Khatoon A, Shukla I, Khan HM. A study of inducible clindamycin resistance in erythromycin resistant clinical isolates


of Staphylococcus species. Asian Journal of Medical Sciences. 2015 May 24;6(6):48-52. [Crossref][PubMed][Google Scholar]

20. Ghogare HS, Hatkar SS, Bansal MP. Phenotypic detection of inducible clindamycin resistance among the clinical isolates of Staphylococcus aureus by using D-test. IJHSR. 2014;4(3):149-53. [Crossref][PubMed][Google Scholar]

21. Manjunath V, Eshwar S, Ramya TG, Mridula RP, Sharma AD. test–its role in detection of inducible resistance to clindamycin in Staphylococcus aureus with special reference to MRSA. Inl J Biol Med Res. 2012;3(1):1430-2. [Crossref][PubMed][Google Scholar]

22. Reddy PS, Suresh R. Phenotypic detection of inducible clindamycin resistance among the clinical isolates of Staphylococcus aureus by using the lower limit of inter disk space. J Microbiol Biotech Res. 2012;2(2):258-64. [Crossref][PubMed][Google Scholar]

23. Sireesha P, Setty CR. Detection of various types of resistance patterns and their correlation with minimal inhibitory concentrations against clindamycin among methicillin-resistant Staphylococcus aureus isolates. Indian journal of medical microbiology. 2012 Apr 1;30(2):165. [Crossref][PubMed][Google Scholar]