E-ISSN:2456-1487
P-ISSN:2456-9887
RNI:MPENG/2017/70771

Research Article

COVID

Tropical Journal of Pathology and Microbiology

2020 Volume 7 Number 2 March-April
Publisherwww.medresearch.in

Red Cell Distribution Width (RDW) – A useful parameter to assess prognosis in COVID patients

Sahai J.1*, Prabhakar P.2, Sahu S.3
DOI: https://doi.org/10.17511/jopm.2021.i02.03

1* Jyotsna Sahai, Resident, Department of Pathology, MGM Institute of Health Sciences, Navi Mumbai, Maharastra, India.

2 Patro Prabhakar, Professor, Department of Pathology, MGM Institute of Health Sciences, Navi Mumbai, Maharastra, India.

3 Shilpi Sahu, Professor and Head, Department of Pathology, MGM Institute of Health Sciences, Navi Mumbai, Maharastra, India.

Background and Objectives: The world is currently grappling with the COVID-19 pandemic. Therefore, it is important to identify reliable and cost-effective biomarkers that can help in triage and early detection of severe patients, thus preventing morbidity and mortality thereby reducing the need for invasive and critical care management. With this study, we aimed to observe --

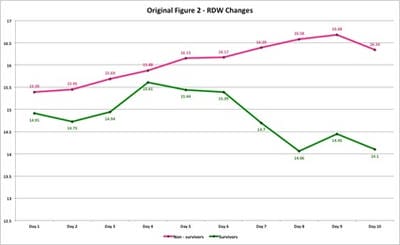
1) Variations in red cell distribution width (RDW) in survivors and non – survivors of COVID – 19.

2) If there is an association between elevated RDW and unfavourable outcome in patients.

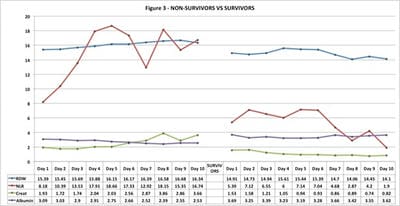
3) If there was an association between RDW and currently used biomarkers. Method: A retrospective study was conducted from June – August 2020 on 100 RTPCR confirmed patients, with 50 admitted in ICU (non-survivors) and 50 in isolation wards (survivors). Eight laboratory parameters with their changes were monitored daily on all patients. Results: We found that all eight parameters (RDW, CRP, LDH, Albumin, WBC count, Ferritin, Creatinine, NLR) were markedly deranged among non-survivors as compared to survivors. A male preponderance was found in the study. RDW values progressively increased in non-survivors till the end of the observation period and indicated unfavourable outcome sooner. In survivors, RDW showed minimal variation throughout the observation period. The RDW values were not affected by complications arising due to COVID-19 infection or by therapy as compared to other biomarkers. Conclusions: RDW showed a direct relationship with other commonly used biomarkers and can be successfully used in triage and treatment of mild, moderate and severe Covid-19 patients.

Keywords: Biomarker, COVID-19, Laboratory, Non-Survivors, Parameters, RDW, Survivors

Corresponding Author How to Cite this Article To Browse
Jyotsna Sahai, Resident, Department of Pathology, MGM Institute of Health Sciences, Navi Mumbai, Maharastra, India.
Email:
Sahai J, Prabhakar P, Sahu S. Red Cell Distribution Width (RDW) – A useful parameter to assess prognosis in COVID patients. Trop J Pathol Microbiol. 2020;7(2):78-84.
Available From
https://pathology.medresearch.in/index.php/jopm/article/view/520

Manuscript Received Review Round 1 Review Round 2 Review Round 3 Accepted
2021-03-10 2021-03-15 2021-04-08 2021-04-15
Conflict of Interest Funding Ethical Approval Plagiarism X-checker Note
No Nil Yes 7%

© 2020 by Jyotsna Sahai, Patro Prabhakar, Shilpi Sahu and Published by Siddharth Health Research and Social Welfare Society. This is an Open Access article licensed under a Creative Commons Attribution 4.0 International License https://creativecommons.org/licenses/by/4.0/ unported [CC BY 4.0].

Introduction

COVID–19 (Corona Virus Disease 2019) is caused by SARS – CoV-2 virus. What initially started as a cluster outbreak in Wuhan city of China later turned into a pandemic, infecting 3,32,26,410 people worldwide and causing 10,00,743 deaths, up to 27.09.2020. The corresponding figures for India during that period were 60,53,010 persons infected and 95,162 deaths [1].

With COVID-19 detected cases showing an ever-increasing trend and the pandemic not showing signs of flattening of the curve, it is imperative to detect its infections at the earliest to minimize mortality and severe morbidity.

With methodologies and treatment protocols for this disease changing almost weekly as per new guidelines formulated and newer methods of diagnostics identified, it is necessary to identify reliable, cost-effective and safe biomarkers which will help in the identification, triage and prognostication of COVID-19 patients and their likely outcomes.

In resource-poor countries like India, with the majority of the population unable to afford the latest diagnostic and treatment modalities, the need for predictive, reliable and cost-effective biomarkers is even greater than in developed nations.

During the early stages of the pandemic, respiratory system involvement was recognized as the primary cause of morbidity and mortality. Later on with increased infections, multi-system involvement along with predisposing factors such as certain comorbidities was also recognized [2-4].

The US Centre for Disease Control and Prevention (CDC) emphasizes that patients with pre-existing conditions such as advanced age (>60 years) or pathologies like cardiovascular disease, diabetes, cancer, hypertension, chronic obstructive pulmonary disease (COPD) are at higher risk of COVID–19 associated morbidity and mortality [5].

In this study we aimed to observe the variations in RDW between survivors and non – survivors suffering from COVID – 19 and if there was any association between elevated RDW and unfavourable outcome in patients. In addition we wanted to assess if a relationship could be established between RDW and other parameters used for triage of patients.

Materials and Methods

This retrospective study was conducted in MGM Medical College and Hospital, Navi Mumbai, Maharashtra, India from June – August 2020, with the approval of the institutional ethical committee. The hospital is a dedicated COVID-19 hospital treating mild, moderate and severe patients.

For this study, 100 clinically confirmed COVID-19 cases, by real-time Reverse Transcriptase Polymerase Chain Reaction (RTPCR) test were selected. They were categorized as mild, moderate and severe, as per Indian Council of Medical Research (ICMR) guidelines for triage of COVID-19 positive patients.[6]

The 50 severe category patients were admitted to the Intensive Care Unit (ICU), and the rest 50 mild and moderate categories in isolation wards. Severe patients had an adverse outcome i.e they expired and were termed as non–survivors, whereas the mild and moderate patients were deemed as survivors.

Patients’ unwilling to participate in the study or not giving informed valid consent, discharged or given Discharge Against Medical Advice (DAMA) or expired within 10 days of admission even after the diagnosis of COVID-19, admitted to the hospital for causes other than COVID-19, Cases confirmed negative for COVID-19 by RTPCR test, patients having any primary haematological disease or diseases known to affect RDW values, patients having haemoglobin values below the normal reference range for age were excluded from the study.

Eight blood investigations sent daily for all patients older than 18 years for 10 days from the day of admission were RDW, White Blood Corpuscle (WBC) count, Neutrophil: Lymphocyte ratio (NLR), Creatinine, C Reactive Protein (CRP), Lactate Dehydrogenase (LDH), Ferritin and Albumin. CBC samples were processed on a six-part automated analyser XN 1000 (Sysmex Corporation) and biochemical parameters on the Beckman Coulter instrument.

On nasopharyngeal swabs taken from suspected COVID-19 patients, the SARS – CoV–2 real-time RTCPR test was performed on Cepheid GeneXpert molecular diagnostic system or Himedia Insta Q48 machine. Another parameter calculated for all patients on the day of admission was the Quick Sequential Organ Failure Assessment (QSOFA) score.


This was calculated using three variables, namely – respiratory rate, altered mental status and systolic blood pressure. The maximum score was three and the minimum score was zero.

For diagnosis of severe COVID-19, at least one of the following conditions had to be met: Shortness of breath, Respiratory rate (RR) >/ = 30/min, Arterial oxygen saturation (Resting status) </ = 93%, or Ratio of Partial pressure of oxygen to Fraction of inspiration O-2 (PaO-2/ FiO-2) < / = 300mmHg [6,7].

Results

We found a male preponderance in both categories in our study and the average age of patients in the survivors’ category was 48.9 years and for non – survivors it was 57.35 years. Hypertension was found to be the most common comorbidity across both categories, followed closely by Diabetes Mellitus.

The mean QSOFA score of both categories is depicted in [Figure 1], which revealed a stark difference. The non–survivors had an average score of 1.55 on the day of admission, which was markedly high in comparison to 0.47 seen in survivors.

patho_520_01.jpg

Fig 1: Mean QSOFA Score for Survivors and Non-survivors on the day of admission

The graph plotted for RDW changes seen in survivors and non–survivors, [Figure 2], revealed that average RDW values were higher in non–survivors throughout the observation period as compared to survivors.

The RDW values in non–survivors showed a rising trend with a peak being reached on day nine of admission. The values were consistently higher than the normal adult range for RDW and didn’t normalize till the end of the observation period.

In comparison, the survivors showed a rise and fall in the RDW values, with a peak being attained earlier in the disease course, around day four of admission and subsequently showing a fall with a return to levels within the normal range.

We found that WBC counts were raised in both categories of patients, but were higher in non–survivors. A differential count analysis revealed that absolute neutrophil count was higher in both categories. When NLR was compared, higher values were seen in non–survivors as compared to survivors from day one of observation. The NLR values of the non–survivors consistently rose and attained two-digit values as the disease progressed and the patients deteriorated. In comparison, the survivors also showed high NLR values but they attained single digit values which lowered as they started improving, suggesting a rising lymphocyte count and remission of the disease.

On comparing creatinine levels between the two categories, a marked difference was seen in the values of this variable. Both categories showed an initial increase in levels, which subsequently lowered and normalised in survivors, but showed an upward trend in non–survivors, with values more than three times the normal being reached with disease progression.

patho_520_02.jpg

Fig 2: RDW variations for Survivors and Non – Survivors during the observation period.

The albumin levels showed significant changes in patients suffering from COVID–19. Survivors had mean levels bordering mild hypo-albuminemia whereas non–survivors showed moderate to severe hypo-albuminemia with mean values ranging from 3.09 g/dl at the highest level to 2.39 g/dl at the lowest. In a comparison of a current lot of heavily relied upon biomarkers, ie, CRP, LDH and Ferritin, it was found that all the parameters showed marked derangement in values for both categories.


But the severity of derangement and rise in values were more drastic and continual for non – survivors as compared to those of the survivors.

[Figure 3] shows the comparative analysis of important triage parameters with that of RDW across both study cohorts in our study. We found a linear relationship being established between RDW and NLR and Creatinine. We also found an inverse relationship between Albumin and RDW in both categories. RDW values were more stable throughout and did not show marked troughs and ridges during the observation period.

patho_520_03.jpg

Fig 3: Comparative analysis of variables with that of RDW across both categories.

Discussion

We studied eight laboratory parameters and their changes amongst two categories of patients. [Table 1] and [Table 2] have a comparison of findings in our study and previously published studies from other countries.

Taking WHO specified predisposing factor of age > 60 years (as a high-risk factor for COVID–19) into consideration, it was noted that 19 survivors were aged >60 years were as there were 25 non – survivors aged >60 years. The non–survivors also showed a male predominance, again confirming theories about higher infectivity rate in males as well as age > 60 years being a predisposing factor for COVID-19.

The next variable studied was the QSOFA score. It was noted that the non – survivors’ had a higher average QSOFA score as compared to that of survivors. Zhou F et al[9] also found a higher QSOFA score in the non–survivors.

In a comparison of our main criteria of the study, RDW, we noted stark differences in the values during the observation period. The survivors had values near the normal range and only mild deviation during the observation period.

In comparison, the RDW values of deceased patients showed marked deviation from normal, with elevated values being seen as the days progressed. The values did not decrease or plateau at a higher range throughout. On performing the Mann-Whitney U Test, it was seen that the U value was 3.5, the Z score was 3.477 and the p-value or predictive value of RDW was .0005 which made the result significant. This confirmed our hypothesis that RDW was significantly deranged in severe COVID – 19 and could be used to assess the prognosis of patients suffering from COVID – 19. Gong J et al[15] also noted higher RDW values in the severe category of patients than in the non–severe category, which was similar to our study.

This finding showed a direct relationship between RDW values and the prognosis of patients as well as the categorization of patients into mild, moderate and severe categories of infection. The WBC changes showed an increasing trend across both categories with higher values noted in non–survivors. This finding was in concordance with that of Foy BH et al, Huang J et al, Wang D et al, Zhang G et al, Gong J et al, Zhou F et al, etc.[8 -12,15] Higher values in non–survivors could also be attributed to superadded bacterial infections as well as ventilator-associated pneumonia (VAP).

NLR is a parameter heavily relied upon for categorization as well as monitoring of patients and has been extensively studied. Our study found that NLR values were raised in both categories, with markedly higher values seen in non–survivors. Gong J et al noted mean NLR values as 1.9 in the non–severe category of patients and 3.7 in the severe category of patients.[15] An increased NLR was suggestive of lymphopenia, which was more pronounced in the non–survivors in comparison to the survivors. Foy BH et al,[8] Zhou F et al,[9] Wang D et al,[12] also found similar findings in their studies with more pronounced lymphopenia in non-survivors.

This study found significantly elevated levels of CRP in non–survivors in comparison to those of survivors. These findings were consistent with those of Gong J et al. [15] Guan et al [13] found that 81.5% of severe cases presented with elevated CRP levels in their study, as compared to 56.4% of non–severe cases. Deng et al[14] also noted that the median CRP levels on admission were 109.25 mg/L in the non–survivor category, which was significantly higher and remained high even after treatment in the said category of patients.


When RDW values were compared with those of CRP values, it was noted that CRP values were affected by the levels of inflammation as well as by the administration of anti-inflammatory drugs. Similar changes weren’t seen in RDW values, which made it a more reliable biomarker in the triage of patients as well as in follow-up observation. The study also found a direct relationship between CRP values and RDW values in both categories of patients.

We found deranged ferritin values in both categories of patients with values in non–survivors being almost double of those in survivors. Zhou F et al found ferritin levels as 1435.3 ug/l in non–survivors and 503.2 ug/l in survivors,[9] which was similar to our study. When RDW values were compared with ferritin values, a linear relationship was observed between the two in both categories.

LDH is another parameter helpful in monitoring treatment as well as in risk stratification of covid patients. In our study, deranged LDH values were noted in both categories, with higher values in non–survivors.

This finding was in concordance with that of Zhou F et al,[9] Gong J et al,[15] Wang D et al[14], and a direct relationship was observed between RDW and LDH. The LDH values showed peaks and fall at the start of anti-viral therapy, which affected its values, which was not the case in RDW values. The RDW values showed a constant rise and were not affected by the institution of therapy, thus indicating the worsening of patients earlier in comparison to inflammatory markers.

Zhou F et al[9] noted that hypo-albuminemia was seen in non–survivors as compared to normal levels in survivors, which was similar to our study. Gong J et al[15] also noted the presence of hypo-albuminemia in the severe category of patients in their study. In non–survivors, it was noted that RDW values were higher and more deranged, whereas albumin values were lower and the patients had hypoalbuminemia. Thus an inverse relationship between albumin levels and RDW values could be established in non–survivors. In survivors, it was noted that RDW and albumin values were within the normal range and occasionally mildly deranged.


Table 1 - Comparison of parameters amongst survivors.

Parameter Foy et al[8] N=1365 Zhou et al[9] N=137 Huang et al[10] N=283 Zhang et al[11] N=166 Wang et al[12] N=102 Guan et al[13] N=926 Deng et al[14] N=116 Current study N=50
Average Age (yr) 59.6 52 52.5 51 51 45 40 48.9
Males, n (%) 723 (53) 81 (59) 149 (52.7) 73 (44) 53 (52) 540 (58.3) 51 (44) 30 (60)
Comorbidities, % 37 40 30 22.9 37.3 21 41.4 60
Hypertension 314 (23) 32 (23) 63 (22.3) 28 (16.9) 22 (21.6) 124 (13.4) 18 (15.5) 16 (32)
Diabetes Mellitus 233 (17) 19 (14) 31 (11) 15 (9) 6 (5.9) 53 (5.7) 9 (7.8) 12 (24)
COPD 55 (4) 2 (1) 5 (1.8) 2 (1.2) 1 (1) 6 (0.6) 3 (2.6) 1 (2)
IHD 110 (8) 2 (1) 14 (4.9) 9 (5.4) 11 (10.8) 17 (1.8) 4 (3.4) 1 (2)

Table 2: Comparison of parameters amongst non-survivors.

Parameter Foy et al[8] N=276 Zhou et al[9] N=54 Huang et al[10] N=16 Zhang et al[11] N=55 Wang et al[12] N=36 Guan et al[13] N=173 Deng et al[14] N=109 Current study N=50
Average Age (yr) 74.6 69 69.2 62 66 52 69 57.35
Males, n (%) 163 (59) 38 (70) 11 968.8) 35 (63.6) 22 (61.1) 100 (57.8) 73 (67) 33 (66)
Comorbidities, % 54 67 87.5 72.7 72.2 38.7 72.5 88
Hypertension 100 (36) 26 (48) 11 (68.8) 26 (47.3) 21 (58.3) 41 (23.7) 40 (36.7) 19 (38)
Diabetes Mellitus 61 (22) 17 (31) 4 (25) 7 (12.7) 8 (22.2) 28 (16.2) 17 (15.6) 18 (36)
COPD 36 (13) 4 (7) 3 (18.8) 4 (7.3) 3 (8.3) 6 (3.5) 22 (20.2) 3 6)
IHD 45 (16) 13 (24) 4 (25) 13 (23.6) 9 (25) 10 (5.8) 13 (11.9) 4 (8)

Conclusion

We noted that when RDW values were compared with other biomarkers used at present, a direct relationship could be established between these parameters and RDW. RDW can successfully be used in assessing the prognosis of COVID-19 patients. Apart from the normally used and heavily relied upon biomarkers for COVID-19 triage and prognosis, RDW is a reliable, cost-effective and easily reproducible biomarker that can be effectively used in risk stratification of patients and to assess prognosis as it is not affected by other variables, cytokine storm or complications occurring due to COVID-19. It also does not show gross variations in values upon the institution of antiviral treatment and thus doesn’t give a false sense of improvement in patient condition or mask significant dangers or deterioration which other biomarkers do so upon administration of anti-inflammatory and antiviral therapies. Thus RDW can be reliably integrated as a routine biomarker along with other markers in the treatment of COVID-19 patients.

Limitations of the study

Our study was limited to the in-hospital clinical course of patients with no follow-up, thus there were no data available in case of relapses. Also it was conducted over a very short period with small sample size, without asymptomatic cases

What does this study add to existing knowledge?

RDW is a reliable, cost-effective and easily reproducible biomarker that can be effectively used in risk stratification of patients and to assess prognosis as it is not affected by other variables, cytokine storm or complications occurring due to COVID-19.

Author contributions

JS and SS collected the data and conducted this study. PP and SS did data analysis. JS and PP did manuscript drafting. All authors were involved in revising and approved the final version of the manuscript.

Reference

  1. Worldometers. info,
  1. Ramachandran P, Gajendran M, Perisetti A, Elkholy KO, Chakraborti A, Lippi G, et al. Red blood cell distribution width (RDW) in Hospitalized COVID–19 Patients. medRxiv preprint. 2020.
  2. Kopel J, Perisetti A, Gajendran M, Boregowda U, Goyal H. Clinical Insights into the Gastrointestinal Manifestations of COVID-19. Dig Dis Sci. 2020 Jul;65(7)1932-1939.
  3. Zaim S, Chong JH, Sankaranarayanan V, Harky A. COVID-19 and Multiorgan Response. Curr Probl Cardiol. 2020 Aug;45(8)100618.
  4. CDC. People who are at higher risk for Severe Illness. CDC. 2020;April 15.
  5. Directorate General of Health Services (EMR Division). Ministry of Health and family Welfare, Government of India. Guidance document on clinical management protocol. COVID-19.
  6. World Health Organisation. Clinical management of COVID-19.
  7. Foy BH, Carlson JCT, Reinertsen E, Padros I Valls R, Pallares Lopez R, Palanques-Tost E, Mow C, Westover MB, Aguirre AD, Higgins JM. Association of Red Blood Cell Distribution Width With Mortality Risk in Hospitalized Adults With SARS-CoV-2 Infection. JAMA Netw Open. 2020 Sep 1;3(9):e2022058.
  8. Zhou F, Yu T, Du R, Fan G, Liu Y, Liu Z, Xiang J, Wang Y, Song B, Gu X, Guan L, Wei Y, Li H, Wu X, Xu J, Tu S, Zhang Y, Chen H, Cao B. Clinical course and risk factors for mortality of adult inpatients with COVID-19 in Wuhan, China- a retrospective cohort study. Lancet. 2020 Mar 28;395(10229)1054-1062.

  1. Huang J, Cheng A, Kumar R, Fang Y, Chen G, Zhu Y, Lin S. Hypoalbuminemia predicts the outcome of COVID-19 independent of age and co-morbidity. J Med Virol. 2020 Oct;92(10)2152-2158.
  2. Zhang G, Hu C, Luo L, Fang F, Chen Y, Li J, et al. Clinical features and outcomes of 221 patients with COVID-19 in Wuhan, China. medRxiv preprint. 2020.
  3. Wang D, Hu B, Hu C, Zhu F, Liu X, Zhang J, Wang B, Xiang H, Cheng Z, Xiong Y, Zhao Y, Li Y, Wang X, Peng Z. Clinical Characteristics of 138 Hospitalized Patients With 2019 Novel Coronavirus-Infected Pneumonia in Wuhan, China. JAMA. 2020 Mar 17;323(11)1061-1069.
  1. Guan WJ, Ni ZY, Hu Y, Liang WH, Ou CQ, He JX, et al. Clinical Characteristics of Coronavirus Disease 2019 in China. N Engl J Med. 2020 Apr 30;382(18)1708-1720.
  2. Deng Y, Liu W, Liu K, Fang YY, Shang J, Zhou L, et al. Clinical characteristics of fatal and recovered cases of coronavirus disease 2019 in Wuhan, China- a retrospective study. Chin Med J (Engl). 2020 Jun 5;133(11)1261-1267.
  3. Gong J, Ou J, Qiu X, Jie Y, Chen Y, Yuan L, et al. A Tool for Early Prediction of Severe Coronavirus Disease 2019 (COVID-19)- A Multicenter Study Using the Risk Nomogram in Wuhan and Guangdong, China. Clin Infect Dis. 2020 Jul 28;71(15)833-840.